As the core power supply unit of the railway communication signal system, the operational stability and performance reliability of the IPU power supply are directly related to railway transportation safety. The railway signal field has extremely stringent requirements for high reliability, high stability, and adaptability to extreme operating conditions of power supply equipment. Addressing the technical bottlenecks of traditional IPU power supply testing, such as complex environmental setup, high manual intervention, time-consuming non-coplanar interface docking (5-8 minutes for single device preparation), incomplete test coverage (lack of voltage/load boundary scenario testing), and poor result consistency, this paper proposes a fully automated testing method for IPU power supplies tailored to railway signal scenarios. This method innovatively adopts a technical architecture of "moving spring probe docking + programmable excitation + multi-dimensional monitoring". Relying on the automatic alignment and elastic fitting characteristics of customized moving spring probes, combined with the bidirectional fixing mechanism of electric cylinders, it achieves high-speed and precise docking of multiple interfaces. Through programmable power supply/load generation of rated and boundary voltage and multi-load combination excitation, coupled with a 16-bit high-precision ADC acquisition circuit, a data acquisition system is constructed. Integrating image recognition technology based on HSV color threshold segmentation, it completes visual monitoring of lamp position status and screen parameters, and integrates a "recognition-recording-retry-alarm" fault adaptive processing mechanism to enhance the stability of the testing process. Experimental verification results show that the testing time for a single IPU power supply is reduced from 15 minutes to 4 minutes, a 60% reduction compared to traditional methods. The fault recognition accuracy rate is over 98%, supporting parallel testing of 10 devices, with a batch testing efficiency increase of 73.3%. It comprehensively covers key performance indicator testing scenarios. This solution effectively eliminates manual operation errors, improves the standardization and traceability of the testing process, and provides efficient and reliable technical support for the quality control of IPU power supply mass production, meeting the stringent application requirements of railway signal equipment.
| Published in | Journal of Electrical and Electronic Engineering (Volume 13, Issue 6) |
| DOI | 10.11648/j.jeee.20251306.14 |
| Page(s) | 278-285 |
| Creative Commons |
This is an Open Access article, distributed under the terms of the Creative Commons Attribution 4.0 International License (http://creativecommons.org/licenses/by/4.0/), which permits unrestricted use, distribution and reproduction in any medium or format, provided the original work is properly cited. |
| Copyright |
Copyright © The Author(s), 2025. Published by Science Publishing Group |
IPU Power Supply, Automatic Testing Method, Mobile Spring Probe Docking
Input Voltage (V) | Output Voltage (V) | Ripple Voltage (mV) | Ripple Factor (%) |
|---|---|---|---|
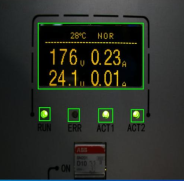
176(-20%) | 23.8 | 182 | 0.76 |
220 (rated) | 24.0 | 169 | 0.70 |
264(+20%) | 24.1 | 191 | 0.79 |
Light Color | H Range | S Range | V Range | Recognition Accuracy (%) |
|---|---|---|---|---|
Red | 0-10 | 120-255 | 100-255 | 99.2 |
Green | 35-77 | 120-255 | 100-255 | 99.5 |
Yellow | 20-30 | 120-255 | 100-255 | 98.8 |
Test Indicators | Traditional Manual Testing | Auto Testing of This System | Improvement Effect |
|---|---|---|---|
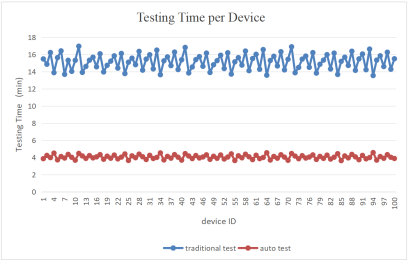
Testing Time per Device | 15 minutes | 4 minutes | Reduced by 60% |
Test Accuracy (Fault Detection) | 85% | 98% | Increased by 13 percentage points |
Number of Devices Tested per Batch | 1 device | 10 devices | Increased by 9 times |
Integrity of Test Data Storage | 60% | 100% | Increased by 40 percentage points |
Interface Docking Success Rate | 92% | 99.8% | Increased by 7.8 percentage points |
Data Acquisition Accuracy (Voltage) | ±0.1V | ±0.01V | Improved by 10 times |
Continuous Operation Stability | 90% | 99.9% | Increased by 9.9 percentage points |
IPU | Industrial Power Unit |
IO | Input/Output |
LED | Light-emitting Diode |
ADC | Analog-to-digital Converter |
OCR | Optical Character Recognition |
HSV | Hue, Saturation, Value |
IP | Internet Protocol |
| [1] | Li Xiaopeng, Wang Yu, Xue Chao, et al. Research on Measurement Method of Odometer [J]. Railway signalling & communication engineering, 2024, 21(3): 77-82. |
| [2] | Jiang Yunwei, Ai Qiangwa, Wu Peidong. Research and Implementation of a General Automatic Testing Platform for Vehicle ATP [J]. Railway signalling & communication engineering, 2024, 21(11): 9-16. |
| [3] | Huang Fei. Research and Implementation of General Automatic Test Platform for Onboard ATP [J]. Modern Information Technology, 2025, 9(6): 67-70. |
| [4] | Huang Hu, Hu Weiwei, Zhou Yifeng, et al. A multifunctional automated power supply test bench [J]. Electric Welding Machine, 2017, 47(12): 47-50. |
| [5] | Yang Peigang, Cao Xiaoyu, Liang Chunyan. Research and Application of Automatic Testing Tool for Data Control Center Equipment in Heavy-Haul Railways [J]. Railway signalling & communication engineering, 2025, 22(3): 46-52, 130. |
| [6] | Peng Dong, Cui Yan, Cao Yaxin. Design and Implementation of an All-Electronic Interlocking Automatic Testing Platform [J]. Railway Communication and Signal Engineering Technology, 2024, 21(5): 32-37,61. |
| [7] | Chen Bidong. Research on Image Recognition Technology in Intelligent Inspection Systems for Signal Equipment Rooms [J]. Railway Signalling & Communication Engineering, 2025, 22(9): 115-121. |
| [8] | Wang Rui. The Application of Virtual Instrument Technology in the Testing and Measurement of Railway Equipment [J]. China Railway, 2024(6): 153-158. |
| [9] | Chen Yuanliang, Ma Fuchen, Zhou Yuanhang, et al. A Review of Dynamic Testing Techniques for Distributed Systems [J]. Journal of Software, 2025, 36(7): 2964-3002. |
| [10] | Huang Hao, Wang Faxiang. Design of a Digital Decimation Filter for Sigma Delta ADC [J]. Electronics Production, 2024, 32(3): 18-22. |
| [11] | Sun Zhike. Research on Development of Interlocking Automatic Test Tool Using Image Recognition Technology [J]. Railway signalling & communication engineering, 2023, (2): 11-16. |
| [12] | Wen Yan, Guo Xiaoqian, Tang Youzhi, et al. Crack Identification Technology Based on Sobel Matching Filter Joint Algorithm [J]. China and Foreign Highways, 2025, 45(4): 33-41. |
| [13] | Song Qiannán, Liu Guangzhu, Wu Lelin, et al. Design of an FPGA Image Edge Detection System Based on Sobel [J]. Electronic Measurement Technology, 2024, 47(13): 68-73. |
| [14] | Gao Yang, Lü Mo, Cui Guangwu. Handling of Train Communication Network Failures and Failure Mode Analysis [J]. Urban Rail Transit Research, 2023, 26(4): 140-144. |
| [15] | Yan Zhanxia. Research on the Simulation of Signal Equipment Operation and Automatic Generation of Test Cases for Railway Section Automatic Block Systems Testing and Evaluation Platform [D]. Shanghai: Tongji University, 2005. |
| [16] | Yang Peigang, Cao Xiaoyu, Liang Chunyan. Research and Application of Automatic Testing Tool for Data Control Center Equipment in Heavy-Haul Railways [J]. Railway Signalling & Communication Engineering, 2025, 22(3): 46-52, 130. |
| [17] | Yu Wenbin, Qiu Zhaoyang. Research on the Testing and Verification Method of Railway Signal Equipment Based on Extended Finite State Machines [J]. Journal of the Railway, 2025, 47(2): 3-91. |
APA Style
Li, C. (2025). Research on Automatic Testing Methods for IPU Power Supplies. Journal of Electrical and Electronic Engineering, 13(6), 278-285. https://doi.org/10.11648/j.jeee.20251306.14
ACS Style
Li, C. Research on Automatic Testing Methods for IPU Power Supplies. J. Electr. Electron. Eng. 2025, 13(6), 278-285. doi: 10.11648/j.jeee.20251306.14
AMA Style
Li C. Research on Automatic Testing Methods for IPU Power Supplies. J Electr Electron Eng. 2025;13(6):278-285. doi: 10.11648/j.jeee.20251306.14
@article{10.11648/j.jeee.20251306.14,
  author = {Caiqi Li},
  title = {Research on Automatic Testing Methods for IPU Power Supplies},
  journal = {Journal of Electrical and Electronic Engineering},
  volume = {13},
  number = {6},
  pages = {278-285},
  doi = {10.11648/j.jeee.20251306.14},
  url = {https://doi.org/10.11648/j.jeee.20251306.14},
  eprint = {https://article.sciencepublishinggroup.com/pdf/10.11648.j.jeee.20251306.14},
  abstract = {As the core power supply unit of the railway communication signal system, the operational stability and performance reliability of the IPU power supply are directly related to railway transportation safety. The railway signal field has extremely stringent requirements for high reliability, high stability, and adaptability to extreme operating conditions of power supply equipment. Addressing the technical bottlenecks of traditional IPU power supply testing, such as complex environmental setup, high manual intervention, time-consuming non-coplanar interface docking (5-8 minutes for single device preparation), incomplete test coverage (lack of voltage/load boundary scenario testing), and poor result consistency, this paper proposes a fully automated testing method for IPU power supplies tailored to railway signal scenarios. This method innovatively adopts a technical architecture of "moving spring probe docking + programmable excitation + multi-dimensional monitoring". Relying on the automatic alignment and elastic fitting characteristics of customized moving spring probes, combined with the bidirectional fixing mechanism of electric cylinders, it achieves high-speed and precise docking of multiple interfaces. Through programmable power supply/load generation of rated and boundary voltage and multi-load combination excitation, coupled with a 16-bit high-precision ADC acquisition circuit, a data acquisition system is constructed. Integrating image recognition technology based on HSV color threshold segmentation, it completes visual monitoring of lamp position status and screen parameters, and integrates a "recognition-recording-retry-alarm" fault adaptive processing mechanism to enhance the stability of the testing process. Experimental verification results show that the testing time for a single IPU power supply is reduced from 15 minutes to 4 minutes, a 60% reduction compared to traditional methods. The fault recognition accuracy rate is over 98%, supporting parallel testing of 10 devices, with a batch testing efficiency increase of 73.3%. It comprehensively covers key performance indicator testing scenarios. This solution effectively eliminates manual operation errors, improves the standardization and traceability of the testing process, and provides efficient and reliable technical support for the quality control of IPU power supply mass production, meeting the stringent application requirements of railway signal equipment.},
 year = {2025}
}
TY  - JOUR
T1  - Research on Automatic Testing Methods for IPU Power Supplies
AU  - Caiqi Li
Y1  - 2025/12/27
PY  - 2025
N1  - https://doi.org/10.11648/j.jeee.20251306.14
DO  - 10.11648/j.jeee.20251306.14
T2  - Journal of Electrical and Electronic Engineering
JF  - Journal of Electrical and Electronic Engineering
JO  - Journal of Electrical and Electronic Engineering
SP  - 278
EP  - 285
PB  - Science Publishing Group
SN  - 2329-1605
UR  - https://doi.org/10.11648/j.jeee.20251306.14
AB  - As the core power supply unit of the railway communication signal system, the operational stability and performance reliability of the IPU power supply are directly related to railway transportation safety. The railway signal field has extremely stringent requirements for high reliability, high stability, and adaptability to extreme operating conditions of power supply equipment. Addressing the technical bottlenecks of traditional IPU power supply testing, such as complex environmental setup, high manual intervention, time-consuming non-coplanar interface docking (5-8 minutes for single device preparation), incomplete test coverage (lack of voltage/load boundary scenario testing), and poor result consistency, this paper proposes a fully automated testing method for IPU power supplies tailored to railway signal scenarios. This method innovatively adopts a technical architecture of "moving spring probe docking + programmable excitation + multi-dimensional monitoring". Relying on the automatic alignment and elastic fitting characteristics of customized moving spring probes, combined with the bidirectional fixing mechanism of electric cylinders, it achieves high-speed and precise docking of multiple interfaces. Through programmable power supply/load generation of rated and boundary voltage and multi-load combination excitation, coupled with a 16-bit high-precision ADC acquisition circuit, a data acquisition system is constructed. Integrating image recognition technology based on HSV color threshold segmentation, it completes visual monitoring of lamp position status and screen parameters, and integrates a "recognition-recording-retry-alarm" fault adaptive processing mechanism to enhance the stability of the testing process. Experimental verification results show that the testing time for a single IPU power supply is reduced from 15 minutes to 4 minutes, a 60% reduction compared to traditional methods. The fault recognition accuracy rate is over 98%, supporting parallel testing of 10 devices, with a batch testing efficiency increase of 73.3%. It comprehensively covers key performance indicator testing scenarios. This solution effectively eliminates manual operation errors, improves the standardization and traceability of the testing process, and provides efficient and reliable technical support for the quality control of IPU power supply mass production, meeting the stringent application requirements of railway signal equipment.
VL  - 13
IS  - 6
ER  -
Beijing National Railway Research & Design Institute of Signal & Communication Group Co., Ltd. Beijing, China